

Abstract
Quantitative structure activity relationship or QSAR is a term used very often in the Pharma and Biochemistry field. It describes a wide range of methods extensively used for the process of drug discovery and other allied biochemical fields. Simply put, it is a methodology to relate the structural properties of an entity or a group of entities with a desired outcome.
QSAR techniques, closely allied with AI/ML techniques are being utilised to further understand the properties of enzymes and receptors and their interaction with a large variety of organic molecules, which we call ligands, aiming towards greater accuracy and lesser use of time and resources.
This article describes QSAR very broadly and indicates the direction in which research on the subject is moving.
Introduction
The scientific community today enjoys a great increase in computational capabilities as well as high-throughput techniques for genome sequencing, microarrays, robotic screening methods, advancements in structure determination methods etc. However, this increase in technology has proved to be a double-edged sword. It has led to a very great increase in raw data. However, our ability to understand and utilise this data is unable to keep up with the generation of this data.
There is thus a corresponding need to understand, annotate and make practical use of this vast data quickly with the minimal use of time and resource.
Computational screening techniques which can quickly move through large databases, derive useful properties from this data and use it to predict useful outcomes or classifications is very much needed in the industry. There is a need to make use of this data for practical purposes, such as drug discovery and industrial use for a greener future. The COVID-19 crisis emphasized the need to discover drugs and design vaccines with great urgency.
QSAR techniques are commonly used for this purpose. QSAR stands for Quantitative Structure Activity Relationship.
Quantitative refers to numbers or quantification of certain properties of an entity or of the desired outcome. Subjective descriptions must be quantified, often as binary fields.
Structure refers to the structure of the entity or entities. The structures can be chemical in nature, such as ligand or receptor structure, or they may even be non-chemical such as electrical or computational network topologies, economic interaction networks, biochemical interaction networks etc. The properties may be derived from structure are called predictor values or variables (X)
Activity refers to the desired outcome in a quantitative form. This activity can be anything, i.e. toxicity, binding affinity, enzymatic activity, substrate loading, enantio-specificity etc. which has been measured or quantified reliably. This is often termed the response variable (Y)
Relationship refers to a model that relates the Structure with Activity. This model is usually a statistical or mathematical model or a machine learning model which can either do prediction or classification
The Past
Chemists around the end of the 19th century and beginning of the 20th century managed to determine various simple properties from organic compounds, such as molecular weight, molecular stoichiometric formula, charge etc. Once sufficient data was obtained, statistical analysis was done, and these properties were used to predict the behaviour of these compounds under different conditions. This was the precursor of QSAR, termed 0D QSAR. Note that some of these techniques are still used extensively as they are very fast.
Similarly, 1D QSARs deal with chemical descriptors like SMILES codes or Fingerprints, which are arrays of binary descriptors noting the presence or absence of features. These models can be used to predict absorption, distribution, metabolism, and excretion ("ADME") properties of potential drugs. Rules of thumb like the “Lipinsky rule of 5”1 don’t always work, so models incorporating many other properties and relationships are included to make the QSAR model more robust. But 1D QSARs may not be enough. Organic compounds exhibit stereoisomers which enzymes in biochemical processes are very sensitive to. Such details may not be captured in 1D-QSARs.
2D QSARS deal with chemical 2D structure data or topologies, connectivity, stereoisomer data etc. and commonly use computational graph theory to derive quantities for the predictors of the QSAR model. These techniques have been used since the 1970s. One such technique is the use of pharmacophores, i.e., 2D templates showing the possible interactions in an enzyme active site, which were matched with ligand data. The degree of this match was quantified and used as a predictor for QSAR. Specialization in the use of these techniques, along with allied informatics techniques such as data storage and retrieval, high-throughput implementation etc. gave rise to the field called Chemoinformatics, which was formally named in 19982
The Present
By the 1980s, the number of structures determined by crystallography techniques had increased to a point where researchers began to look at methods to incorporate this 3D data into QSAR models. 2D QSARs do not take the 3D structure of proteins and receptors into account. Also, the ligands themselves show structural flexibility, i.e. configurational entropy. 3D-QSARs use the 3D structure of potential drugs (ligands) and Enzymes (receptor) to derive quantities for relationship analysis.
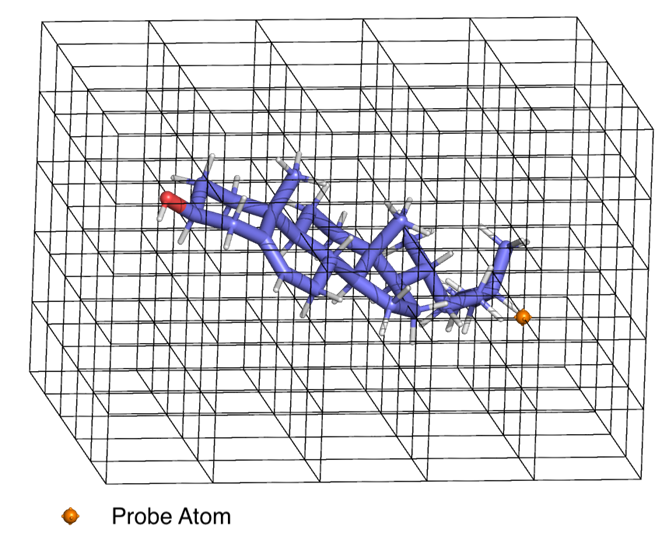
QSAR models will vary greatly based upon how we derive predictor quantities. The methodologies for deriving and using these quantities, though not directly a part of the QSAR model, are closely associated with them. One such important method is the CoMFA (comparative molecular field analysis) method by Cramer et al3 by calculating a molecular field (MF) within a grid with the ligand or receptor using a probe atom(Figure 1). Matching the ligand MF with receptor MF was done using partial least squares fit.
Figure 1: Mapping the molecular field within the grid using a probe atom (CoMFA). The probe atom is placed at each intersection of the grid and the forces – electrostatic, VDW, h-bonding etc. acting on it is measured and associated with that point on the grid. A grid of greater resolution can capture a more detailed map of the forces acting in the entire 3D space due to the molecule – in this case cholesterol.
Faster methods to search the configurational space and the best positions scored were developed as well as more complex methods to generate the grid and the ligand is matched with the enzyme’s molecular field in the grid. The procedure for doing this is called Docking, and the fast methods themselves called docking protocols or implementations, of which there are many, such as Autodock, Dock6, Gold etc. High-throughput screening can be implemented for ligands.
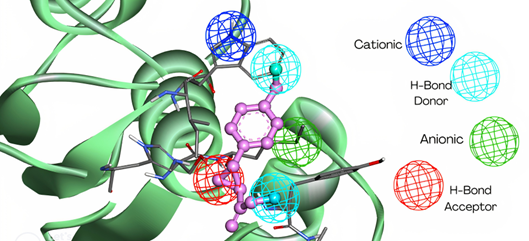
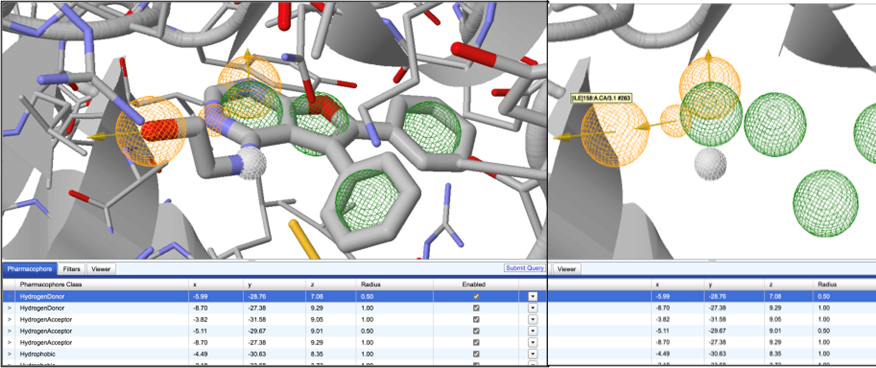
To speed up computation, the enzyme active site itself may be defined as a 3D-pharmacophore4, which is a 3-dimensional template of molecular properties (Figure 2)5 limited to the active site within a grid.
Figure 2: 3D pharmacophore describing the active site on the left. This is from the online Zinc Pharmer server. The spheres, on the known ligand bound within active site, show Hydrogen Donor (orange), Hydrogen Acceptor(white) and hydrophobic (green) parts of the ligand. The 3D pharmacophore describes the properties required by a ligand to bind in the active site of a receptor
The 3D pharmacophore from the same system shown on right. The pharmacophore components are clearly seen in exclusion to the ligand. This pharmacophore is used to search databases like the Zinc Database using the Submit Query button, which will give compounds which match the 3D pharmacophore properties, with higher likelihood of binding to the active site.
3D-Pharmacophores may be constructed not just from one structure but summarise the average position of molecular features in many related enzymes with the same active site. They can be shared and used in place of molecular structure and are a feature of many 3D-QSAR protocols
The docking protocol makes use of the 3D structures of ligand and receptor to derive quantities such as an estimate of binding energy between ligand and receptor.
The future
As we utilise 3D-QSAR methods, we realise that it may not be able to account for all the properties of the enzyme.
Enzymes are dynamic entities, which are constantly in motion over time, which is very unlike the crystal structures or 3D-Pharmacophores we discussed before. Such motion can be simulated using molecular dynamics simulations within the limitations of timescale (from femtoseconds up to micro or milliseconds). Normal mode analysis (NMA) or elastic network NMA may also be used to estimate large changes possible in structure that simulations cannot sample (larger than milliseconds). The time data, which can be considered a summary of possible motions of an enzyme receptor, can be incorporated into the QSAR model.
The three dimensions in 3D-QSAR refers to the (X,Y,Z) coordinates in space. The fourth dimension is time. This QSAR model is thus called a 4D-QSAR model6,7. There are many methods to incorporate this time data, some of which are Receptor-Dependent or Receptor-Independent8 depending in whether the ligand and the receptor are both sampled in time or just the ligand is sampled in time.
However, enzymes are more complex than that. Induced fit is a very common phenomenon, where an enzyme often changes its form to accommodate a ligand. This is seen as an effect of perturbation or stimulus. If structural details of Apo vs bound form are available for certain ligands, this data can be used to construct a QSAR model. One such model is the QUASAR model9.
A new dimension is defined, referred to as stimulus, and the method has been called 5D-QSAR9.
Figure 3: Transition of open and closed form from structures with pdb IDs 2Z8X and 3A6X. Such changes occur due to a stimulus, such as substrate binding to the active site. These changes can be captured and used for 5D QSAR
Enzymes are also affected by solvent changes, such as the incorporation of DMSO in water. This is modelled as a change in Solvation mapping. A solvation shell can be incorporated as data. This methodology has been called 6D-QSAR10 and is useful for industrial purposes. Newer dimensions may be defined in the future for more properties. As QSAR and AI/ML have many points of similarity, AI is being increasingly incorporated in QSAR protocols11 and AI/ML QSAR models may well be common in the future.
The above is a general description of a very vast field with a long history. Several reviews of the subject are available8,12 for more in-depth understanding of QSAR techniques used in the past and the future prospects of the field. At Quantumzyme, we utilize 3D-QSAR techniques and are exploring the higher dimensions of QSAR. 4D-QSAR techniques were used for engineering mutations on serine proteases7. Using the technique, 4D-QSAR analysis on the variants of a serine protease - blood coagulation Factor XIa - that was observed with different enzymatic activities against two different substrates. The technique was successfully used to predict the effect of mutations on the activity of the Serine protease. The predicted values of Kcat were closer to experimental values except the outliers with very high or very low values. In the latter case, the values were either much lower than low values of Kcat or very high for high values of Kcat7
References:
- Lipinski, C. A., Lombardo, F., Dominy, B. W. & Feeney, P. J. Experimental and computational approaches to estimate solubility and permeability in drug discovery and development settings. Adv. Drug Deliv. Rev. 46 , 3–26 (2001).
- Brown, F. K. Chapter 35 - Chemoinformatics: What is it and How does it Impact Drug Discovery. in Annual Reports in Medicinal Chemistry (ed. Bristol, J. A.) vol. 33 375–384 (Academic Press, 1998).
- Cramer, R. D., Patterson, D. E. & Bunce, J. D. Comparative molecular field analysis (CoMFA). 1. Effect of shape on binding of steroids to carrier proteins. J. Am. Chem. Soc. 110 , 5959–5967 (1988).
- Stoll, F. et al. Pharmacophore Definition and Three-Dimensional Quantitative Structure-Activity Relationship Study on Structurally Diverse Prostacyclin Receptor Agonists. Mol. Pharmacol. 62 , 1103–1111 (2002).
- Voet, A. et al. Pharmacophore modeling: advances, limitations, and current utility in drug discovery. J. Recept. Ligand Channel Res. 81 (2014) doi:10.2147/JRLCR.S46843.
- Martins, J. P. A., Barbosa, E. G., Pasqualoto, K. F. M. & Ferreira, M. M. C. LQTA-QSAR: A New 4D-QSAR Methodology. J. Chem. Inf. Model. 49 , 1428–1436 (2009).
- Kumar, R. P. & Kulkarni, N. A receptor dependent-4D QSAR approach to predict the activity of mutated enzymes. Sci. Rep. 7 , 1–13 (2017).
- Damale, M., Harke, S., Kalam Khan, F., Shinde, D. & Sangshetti, J. Recent Advances in Multidimensional QSAR (4D-6D): A Critical Review. Mini-Rev. Med. Chem. 14 , 35–55 (2014).
- Vedani, A. & Dobler, M. 5D-QSAR: The Key for Simulating Induced Fit? J. Med. Chem. 45 , 2139–2149 (2002).
- Vedani, A., Dobler, M. & Lill, M. A. Combining Protein Modeling and 6D-QSAR. Simulating the Binding of Structurally Diverse Ligands to the Estrogen Receptor. J. Med. Chem. 48 , 3700–3703 (2005).
- Hasegawa, K., Matsuoka, S., Arakawa, M. & Funatsu, K. New molecular surface-based 3D-QSAR method using Kohonen neural network and 3-way PLS. Comput. Chem. 26 , 583–9 (2002).
- Understanding the Basics of QSAR for Applications in Pharmaceutical Sciences and Risk Assessment . (Elsevier, 2015). doi:10.1016/C2014-0-00286-9.